Read in : தமிழ்
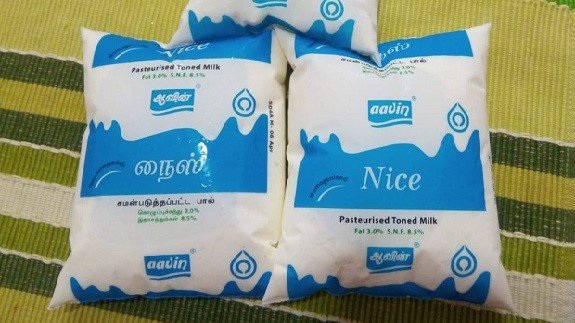
A brand audit of plastic pollution by Citizen consumer and civic Action Group (CAG) shows that Aavin contributed 7.0% of all plastic pollution in Tamil Nadu and came second among brands that pollute with plastic. Unilever came first at 8.3%. Unbranded plastic came first at over 25% together.
The brand audit has been conducted by CAG since 2018. The 2021 brand audit survey whose results were released earlier this year was largely home-based because of the restrictions due to the pandemic. The audit was conducted by Vamsi Sankar Kapilavai and Sumana Narayanan, senior researchers at the CAG. Other plastic polluters were Brittania, Nestle, ITC, Mondelez, Sakthi Masala and so on.
The saving grace with Aavin’s case was that 98% of its plastic was recyclable since it was made of LDPE that lends itself to recycling. Sakthi Masala sachets were 100% non-recyclable.
Aavin has a policy of buying back its milk packets although Sumana Narayanan noted that anecdotally local Aavin offices were refusing to take back milk packets. She said that while Aavin milk packets are recyclable, the smaller ones, sachets, are not recyclable. “The effort involved in collecting them would just be too much so there is no market for the recycling of sachets,” she said.
Sumana Narayanan says the only sustainable eco-friendly alternative would be to go back to the time when we had milkmen supplying in bottles that would be reused. “No single-use bottle,” she adds. The button-milk kiosks that Aavin had at one time were highly eco-friendly since people bought their own vessels to fill the milk, she says.
Sumana Narayanan says the only sustainable eco-friendly alternative would be to go back to the time when we had milkmen supplying in bottles that would be reused. “No single-use bottle,” she adds.
A majority of the type of plastic was non-recyclable and Aavin contributed in a major way to the 12% LDPE type plastic polllution. This year, due to the COVID-19 pandemic restrictions, the brand audit could not be conducted outdoors and had to be home-based.
Nationwide, Tamil Nadu stands second only to Maharashtra by generating 4.01 lakh tonnes of plastic per year. Maharashtra generates 4.09 lakh tonnes.
Chennai generates 429 tonnes of plastic waste daily. Almost all of this is carted to two dump yards in Kondungaiyur and Perungudi which are located on water bodies. In June 2018, the Government of Tamil Nadu announced a ban on the manufacture, sale, and use of single-use plastics which was to come into force from January 1, 2019. The ban listed 14 specific items (such as plastic straws, cups, plates and carry bags) but did not restrict itself necessarily to just these. Plastic packaging of groceries was explicitly exempted from this ban. In June 2020, a year and a half into the ban, plastic packaging of groceries was added to the banned items list.
In 2020 and again in 2021, CAG conducted a study of the single-use plastic ban in Tamil Nadu to assess the implementation of the ban one year and two years after the ban came into force respectively. The studies, focused on Chennai, found that implementation was poor to non-existent.
Soon after the ban was announced, there was a discernible reduction in single-use plastic use in shops and markets, says Vamsi Sankar Kapilavai. The Greater Chennai Corporation (GCC) had also conducted several checks and raids. However, after the initial flurry of attention on the ban, the focus on implementation reduced and single use plastics became a common sight in shops again. “This underlines the need for continued enforcement of the ban,” he adds.
Nationwide, Tamil Nadu stands second only to Maharashtra by generating 4.01 lakh tonnes of plastic per year. Maharashtra generates 4.09 lakh tonnes.
The brand audit, developed by CAG, Mother Earth, Greenpeace Philippines, and GAIA, in 2018, seeks to identify the biggest plastic polluter company through a waste audit. The brand audit is a citizen-science initiative anchored by BFFP, that has spread across the globe with 440 brand audits conducted across 45 countries in 2021.
The brand audit also found that 62 per cent of the plastic was from food packaging, with personal care (16.1 per cent) and household products (15.3 per cent) bringing in the second and third highest amount of plastic. The remaining plastic was of packing material (such as external packing from online shopping) and smoking material which is a very miniscule amount. The trend is the same as last year where food packaging was 56.7 per cent, followed by personal care (6.5 per cent), household packaging (3.2 per cent) and less than one per cent packing material and no smoking material. Interestingly, packing material has increased from less than one per cent to about six per cent.
Read in : தமிழ்